by Lexie Thomas, WP owner, and Vera Snodgrass, WP writing intern
Annual reports are not just used to explain the current state of your business—they’re an opportunity to connect with your investors, stakeholders, and employees. The most successful annual reports go way beyond numbers and industry and financial jargon. They tell stories.
Don’t want to waste the big opportunity your annual report offers? Check out our list of ways to add some charisma to the page and keep your readers engaged:
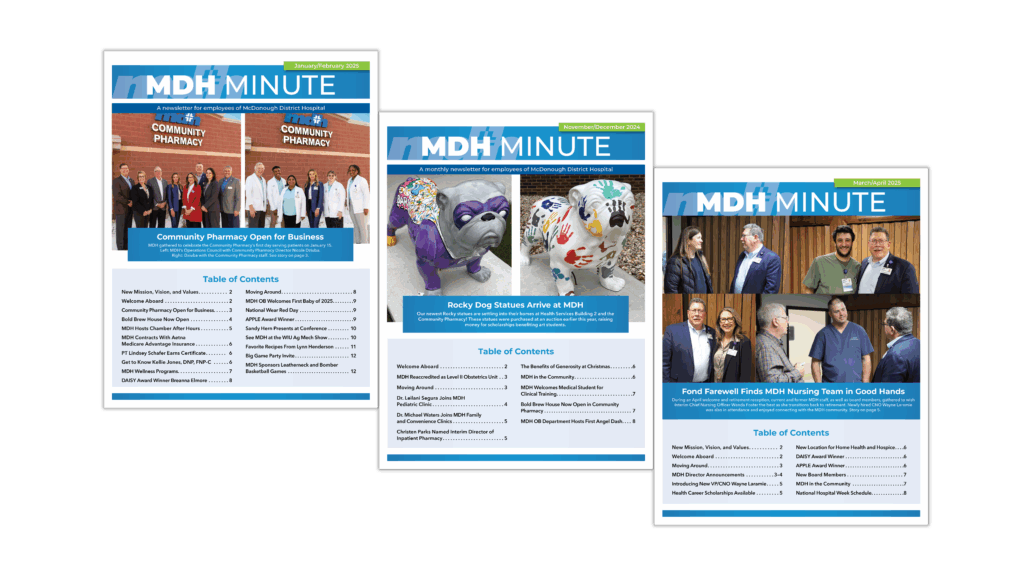
- Include brief people features. Tell the stories of those your work impacted in the past year. Quantify the benefits they saw if possible and make the extra effort to get a photo.
- Consider using a narrative approach alongside numbers. Describe the steps that led to your business’s results. Turn this information into a story with a beginning, middle, and end.
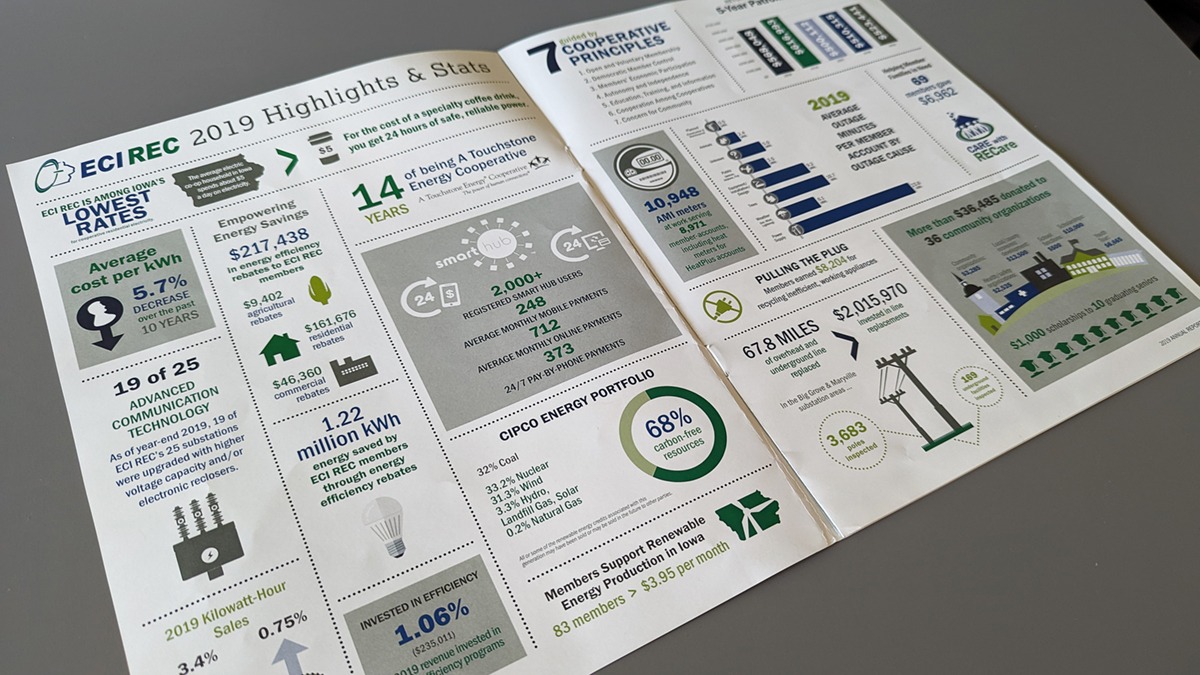
- Use data visualization. Using the right type of chart or table and then attractively designing it not only reinforces the information—comprehension skyrockets.
- Add infographics to take a more visual approach to sharing editorial content and relationships between information. A timeline is a type of infographic that can be an especially good fit for an annual report.
- Give a snapshot into the future. What is your business working on? Invite readers to follow your blog or social channels to stay up to date on your progress. Give them a reason to stay connected all year and to look forward to the annual report again next year.
- Drive traffic to your digital assets with QR codes. Leverage QR code types for specific purposes. Web pages are certainly a target, but QR codes can also trigger a PDF download or call up a landing page with links to all your social channels.
- Take your report online. Create a micro-site on your website that shares the same information as your on-paper annual report. It’s easy to enhance your online report with embedded videos.

A timeline graphic can be a great fit for an annual report.
While we’re all for creativity in spicing up your annual report, a note of caution: There are likely important stakeholders who want and require concise and unadorned financials. Whether this information is covered in a carefully constructed executive summary or handled with a section of basic charts and tables, be sure to also cater to this audience in your report’s pages.
If you’re interested in adding professionally crafted visuals to your annual report, or another project, the Write Place has you covered. We can create striking infographics, charts, and tables for all your projects. Give us a call at 641-628-8398 or email hello@thewriteplace.biz.


